Cartography: Types of Maps
Isarithmic maps are designed to help depict a particular trend within a geographical area. Isarithmic maps have contour lines separating the differences in trends. Isarithmic maps are also known as contour maps. These trends can be "physical, social, political, cultural, economic, sociological, agricultural, or any other aspects of a city, state, region,nation , or continent." Isarithmic maps usually show a smooth continuous trend. The example above is an isarithmic map of barometric pressure.
Dot density maps use dots to represent the presence of a certain trend or phenomena. Each dot represents a one-to-one ratio or a one-to-many ratio. The more concentrated the dots, the more data in that area. Dot density maps can be used to show the population in certain areas. The picture above is an example of a dot density map.
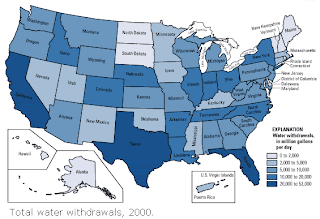
Chloropleth maps are based on a predefined areal units such as countries and states. Chloropleth maps are specifically used for showing records of the census or the percentage of republicans or democrats in a given state. The picture above is an example of a chloropleth map.
--------------------------------------------------------------------------------------------------------
Above is the image of an Isarithmic Map of The Annual Precipitation in Georgia.
----------------------------------------------------------------------------------------------------
Above is an image from Google Earth of my "HAPPY PLACE". It is located in Ponce Inlet, Florida.
The above shaded area is from Google Earth of my family's home and land.
The above line is the walking path that Michael and I walk every afternoon that we can after work together for our exercise. The path begins at his home and then ends at McDonalds. We then return home on the same path.


No comments:
Post a Comment